Modifying Pre-Designed Reports for Your Farm(s)
The BoviSync team has developed an extensive set of pre-designed reports for users in the Reports menu (depicted below),Bovi-Insights-> Search, and Report Map.
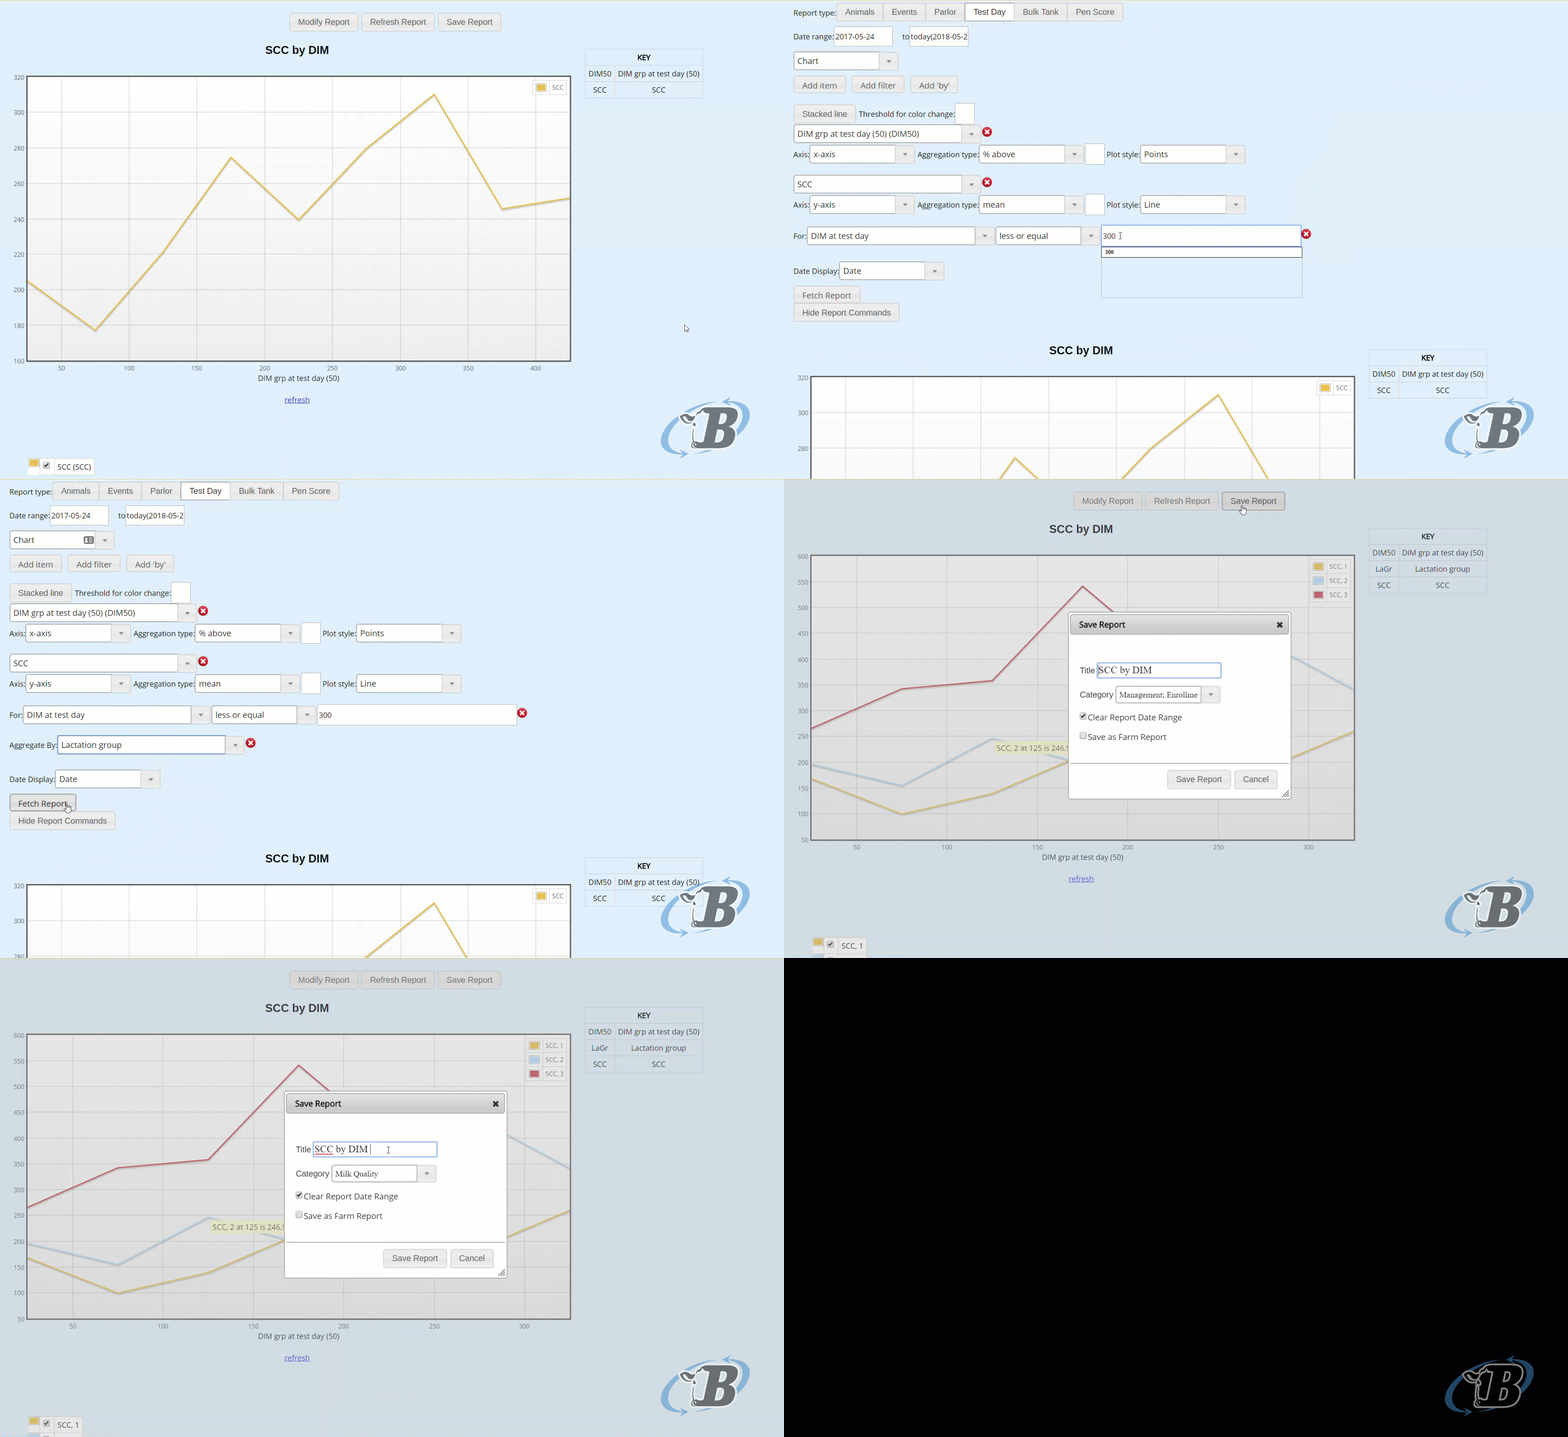
However, there will always be needs for farm-specific reports beyond these pre-designed reports. One of the best ways to create a new report is to modify a pre-designed report to fit your specific report needs. Here is a simple example of how to modify a report. We will use this SCC by DIM report for this demonstration, which depicts DIM on the x axis and SCC on the y axis.
Let's say you like this graph, but you would like to see similar information categorized by lactation group and only for the first 300 days in milk.
Here are the steps to follow to make these changes:
1. Click the "Modify Report" button above the graph.
2. Under the last "for" statement, change "DIM at test day" to less or equal to 300.
3. Next, click on the "Add by" button.
4. For "Aggregate By", type "Lactation group."
5. Click on "Fetch Report" below the input boxes.
6. The new graph should now show there lines (one for each lactation group) and a shorter length for the x-axis of 300 days as depicted below.
Now that you have the new report to better meet your farm-specific needs, you can save it as a farm report:
1. Click the "Save Report" button.
2. Change the title of the report to better reflect the new report. For example, you could change it to "SCC by DIM by Lact."
3. In the category dropdown menu, change the category to "Milk Quality."
4. Check the "Save as Farm Report" button.
5. Click on "Save Report."
6. Now, the graph will show up in your farm reports.
For other options on saving reports, read the Report Basics: Save/Edit/Delete article.
Video Example

Related Articles
Report Guide: Report Map and Global Reports
With dairy data, the possibilities for investigating data from different angles can be overwhelming. BoviSync has created a Report Map and a library of Global Reports with many pre-designed reports available to any farm or user. The Report Map ...Adding a BoviSync page to Farm Reports
The breeding intensity report is a built in BoviSync report. If you want to add that to a menu, you can do that in the report manager. Setup > Report Manager > Farm Reports > Add Menu Item In the report manager, in farm reports: click on "add menu ...Using Company Reports and Report Packs
Company users have access to a set of reports that have been created specifically for your company by your company administrator. When viewing reports in Report Manager, you may have both Company Reports and Report Pack tabs. When logged into a farm, ...Pulling Hospital and Treatment Data in BoviSync Reports
BoviSync makes it very easy and efficient to access treatment and hospital event data through its reporting tools. With just a few clicks, you can generate reports that help you monitor animal health, treatment outcomes, and compliance with ...Farm Sires
Background and Purpose BoviSync allows users to use both current and new bulls in events. Many farms are using bulls that haven't been added to active sire lists. Entries and imports create "farm sires" in pedigrees, breedings, and implants when they ...