Report Basics
Pre-defined or Global Reports
BoviSync comes with many pre-defined reports that are most often used. These reports are grouped into production, reproduction, health, fresh cows, youngstock, milk quality, genetics, and management.
You can also access pre-designed reports via the Report Map or Report Starter Set. The Report Wizard is designed to easily develop a new report from scratch.
Report Types
There are six basic report types: those based on (1) animals, (2) events, (3) parlor, (4) test day, (5) bulk tank, and (6) pen score data. Report types are depicted at the top of the report screen as shown below:

The difference is in what data you are calling up. For example, if you want to see the latest DHIA milk production data, you could get an animal-based report on milk production. This report would give the most recently measured milk production for each animal, not necessarily the same day, as dry animals may have had a test day a month earlier, thus mixing test dates. A test day report for milk production would be based on each test; therefore the average milk production can be on a test day average. With animal and test day reports, only one line per animal is output. Event reports are designed to summarize events and can include multiple events per animal. Parlor reports are for data provided by milking parlors. Bulk tank reports are for bulk tank data. Pen score reports are for data entered without identification (i.e. % of cows ruminating). Animal-based reports are the default, and if a different type of report is desired, you must select the report type from the top line of the report wizard.
Report Styles
There are three styles of reports, tables, charts, and summary tables. Tables provide tabled information, while charts present the data in a graphical format.
Date Ranges
The date range limits the report to specific date ranges. If no value is given for the start date, one year before the end date is assumed. If no value for the end date is given, the current session date is assumed. This can be used for bookmarking reports. If you want to create a bookmark on your internet browser, fetch the report with the dates blank. Then bookmark this report, then every time you call it up, it will default to the current date and the past year. In addition to using the actual numerical dates, examples of possibilities within the date range include today, tomorrow, yesterday, first of month, end of last month, 1 week ago, 1 year ago, 30 days ago, this week Monday, last week Monday, and next week Monday.


Add items
Clicking on the "Add item" button will add an additional item to your report, opening a new dialog box for each item created. Once the item is created, you can type in words that are part of the item you want to add to the report. It can be useful to look at the available animal and event item lists.

Add Filters
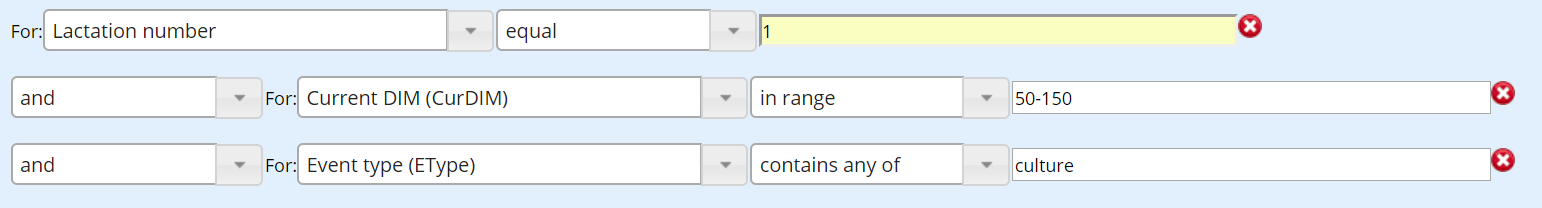
Filters are designed to limit information provided on a report to specific criteria. One or multiple criteria can be set for a report. For example, the filter below would limit the report to any events containing the word "culture" for lactation 1 animals between 50 to 150 days in milk (DIM).
To use filters with dates, you can use most traditional date formats like YYYY-m-d and m/d/Y. Additionally, you may use relative plain words such as today, yesterday, tomorrow, in 5 weeks, in 1 year, 23 days ago, 2 months ago. These can be of particular use when you want to save a report that automatically updates the filter date every day it is opened.
Add 'by
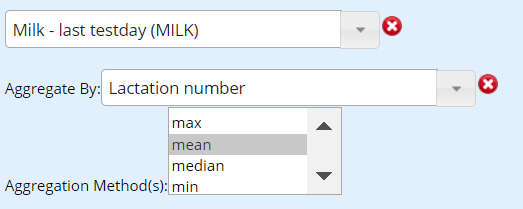
The "Add by" button provides the opportunity to aggregate items by specific criteria. In the example below, the item in the report is last test day milk. After clicking on the "Add by" button, lactation number was selected as the "Aggregate by" Category with "Mean" selected as the "Aggregation Method." This report would provide the average milk production at last test day for each lactation.
Animal Groups
Here, you can select which animal groups you want to include in the report.

In herd/Dead
Here, you can choose to whether to include only animals currently in the herd or to include dead/sold animals within the report.

Date handling
You can change the handling of dates from dates to day of the week, month, year, day of the month, AM/PM, among others. This allows you to break down time-based data sets into many different ways, to look at different trends. An example would be looking at conception rates for AM/PM breeding's as well as by week of the year.
Chart only options
Stacked Lines - Here lines can be summed together to create a stacked line graph. An example would be mastitis cases by month, for the different lactation groups.
Threshold for color change – Input a value into this box and values above/below this number will have different colors. This can be useful for easy visual identification of SCC values above 200, among other uses.
Axis – This is a per item setting. You can select what axis you want the value to be plotted on, choices are x-axis and y-axes 1, 2 and 3.
Aggregation Type – This defaults to scatterplot (no aggregation), but if you want to see the average milk production for the past year by month, individual points won’t give you a good idea of this, so in the aggregation type, select mean (average).
Plot Style – You can change the type of plotting options you desire. The default is individual points, but you can select different types of line graphs, or bar graphs.
Tables
Tables are the most straightforward type of report. Figure out what items you want on the report, select add item, choose the item, repeat. If you want to filter the results to only heifers, then create a filter that is lactation number is equal to 0, or lactation group is less than 1, or some other way to describe heifers. When doing animal reports, a good item to include is ID - Link (ID w/ Link), this allows you to click on the ID and it will bring up the cow card for that animal to get more information on. Similarly, when doing aggregate reports (below is an example of Milk and SCC by lactation group), the name in the aggregate type column, also has a link. This link will take you to the group page for the animals that are included in that row of the report. (Below example, click on LaGr=2, and you will get a group page of all animals that are in lactation group 2).
2x2 Tables
2x2 tables only allow two report items and they split them up by user-provided values. An example of this would be last SCC and the previous,(Reports > Production > Last Testday > SCC x Prev SCC). The four circled boxes in clockwise fashion are last SCC was above 200 and the previous test was below 200 (new infection), next is chronic infection, then cured, and finally back at the top, not infected.
Graphs
Graphs can provide data in a way that you can visually analyze and inspect very quickly. They are great for providing information on trends over time. They are put together similarly to the way tables are put together, using the same items and filters, but graphs come with another bevy of options described in the chart only options section.
Related Articles
Report Examples
Update: BoviSync is moving away from the classic reports and recommends using Bovi-insight reports. Introducing Bovi-Insights Reporting. Intermediate Bovi-Insights Reporting. Print and Export Options in Bovi-Insights. . BoviSync offers tremendous ...Modifying Pre-Designed Reports for Your Farm(s)
The BoviSync team has developed an extensive set of pre-designed reports for users in the Reports menu (depicted below),Bovi-Insights-> Search, and Report Map. However, there will always be needs for farm-specific reports beyond these pre-designed ...Save, Edit, Delete and Tips for Reports in BoviSync
This video shows the basics of saving, editing, deleting, as well as some tips/tricks working with reports in BoviSync. Video Tutorial: To play this video in fullscreen, click here Related Articles: Configuring Auto-Downloads for Reports ...Report Guide: Report Map and Global Reports
With dairy data, the possibilities for investigating data from different angles can be overwhelming. BoviSync has created a Report Map and a library of Global Reports with many pre-designed reports available to any farm or user. The Report Map ...Bovi-Insights Reports Introduction
Benefits and features Easy and powerful reports demonstrate the next generation of BoviSync reporting. Save time with quickfilters. Replace excel with advanced features. These reports are being used to manage dairies of all sizes. Enjoy these ...